
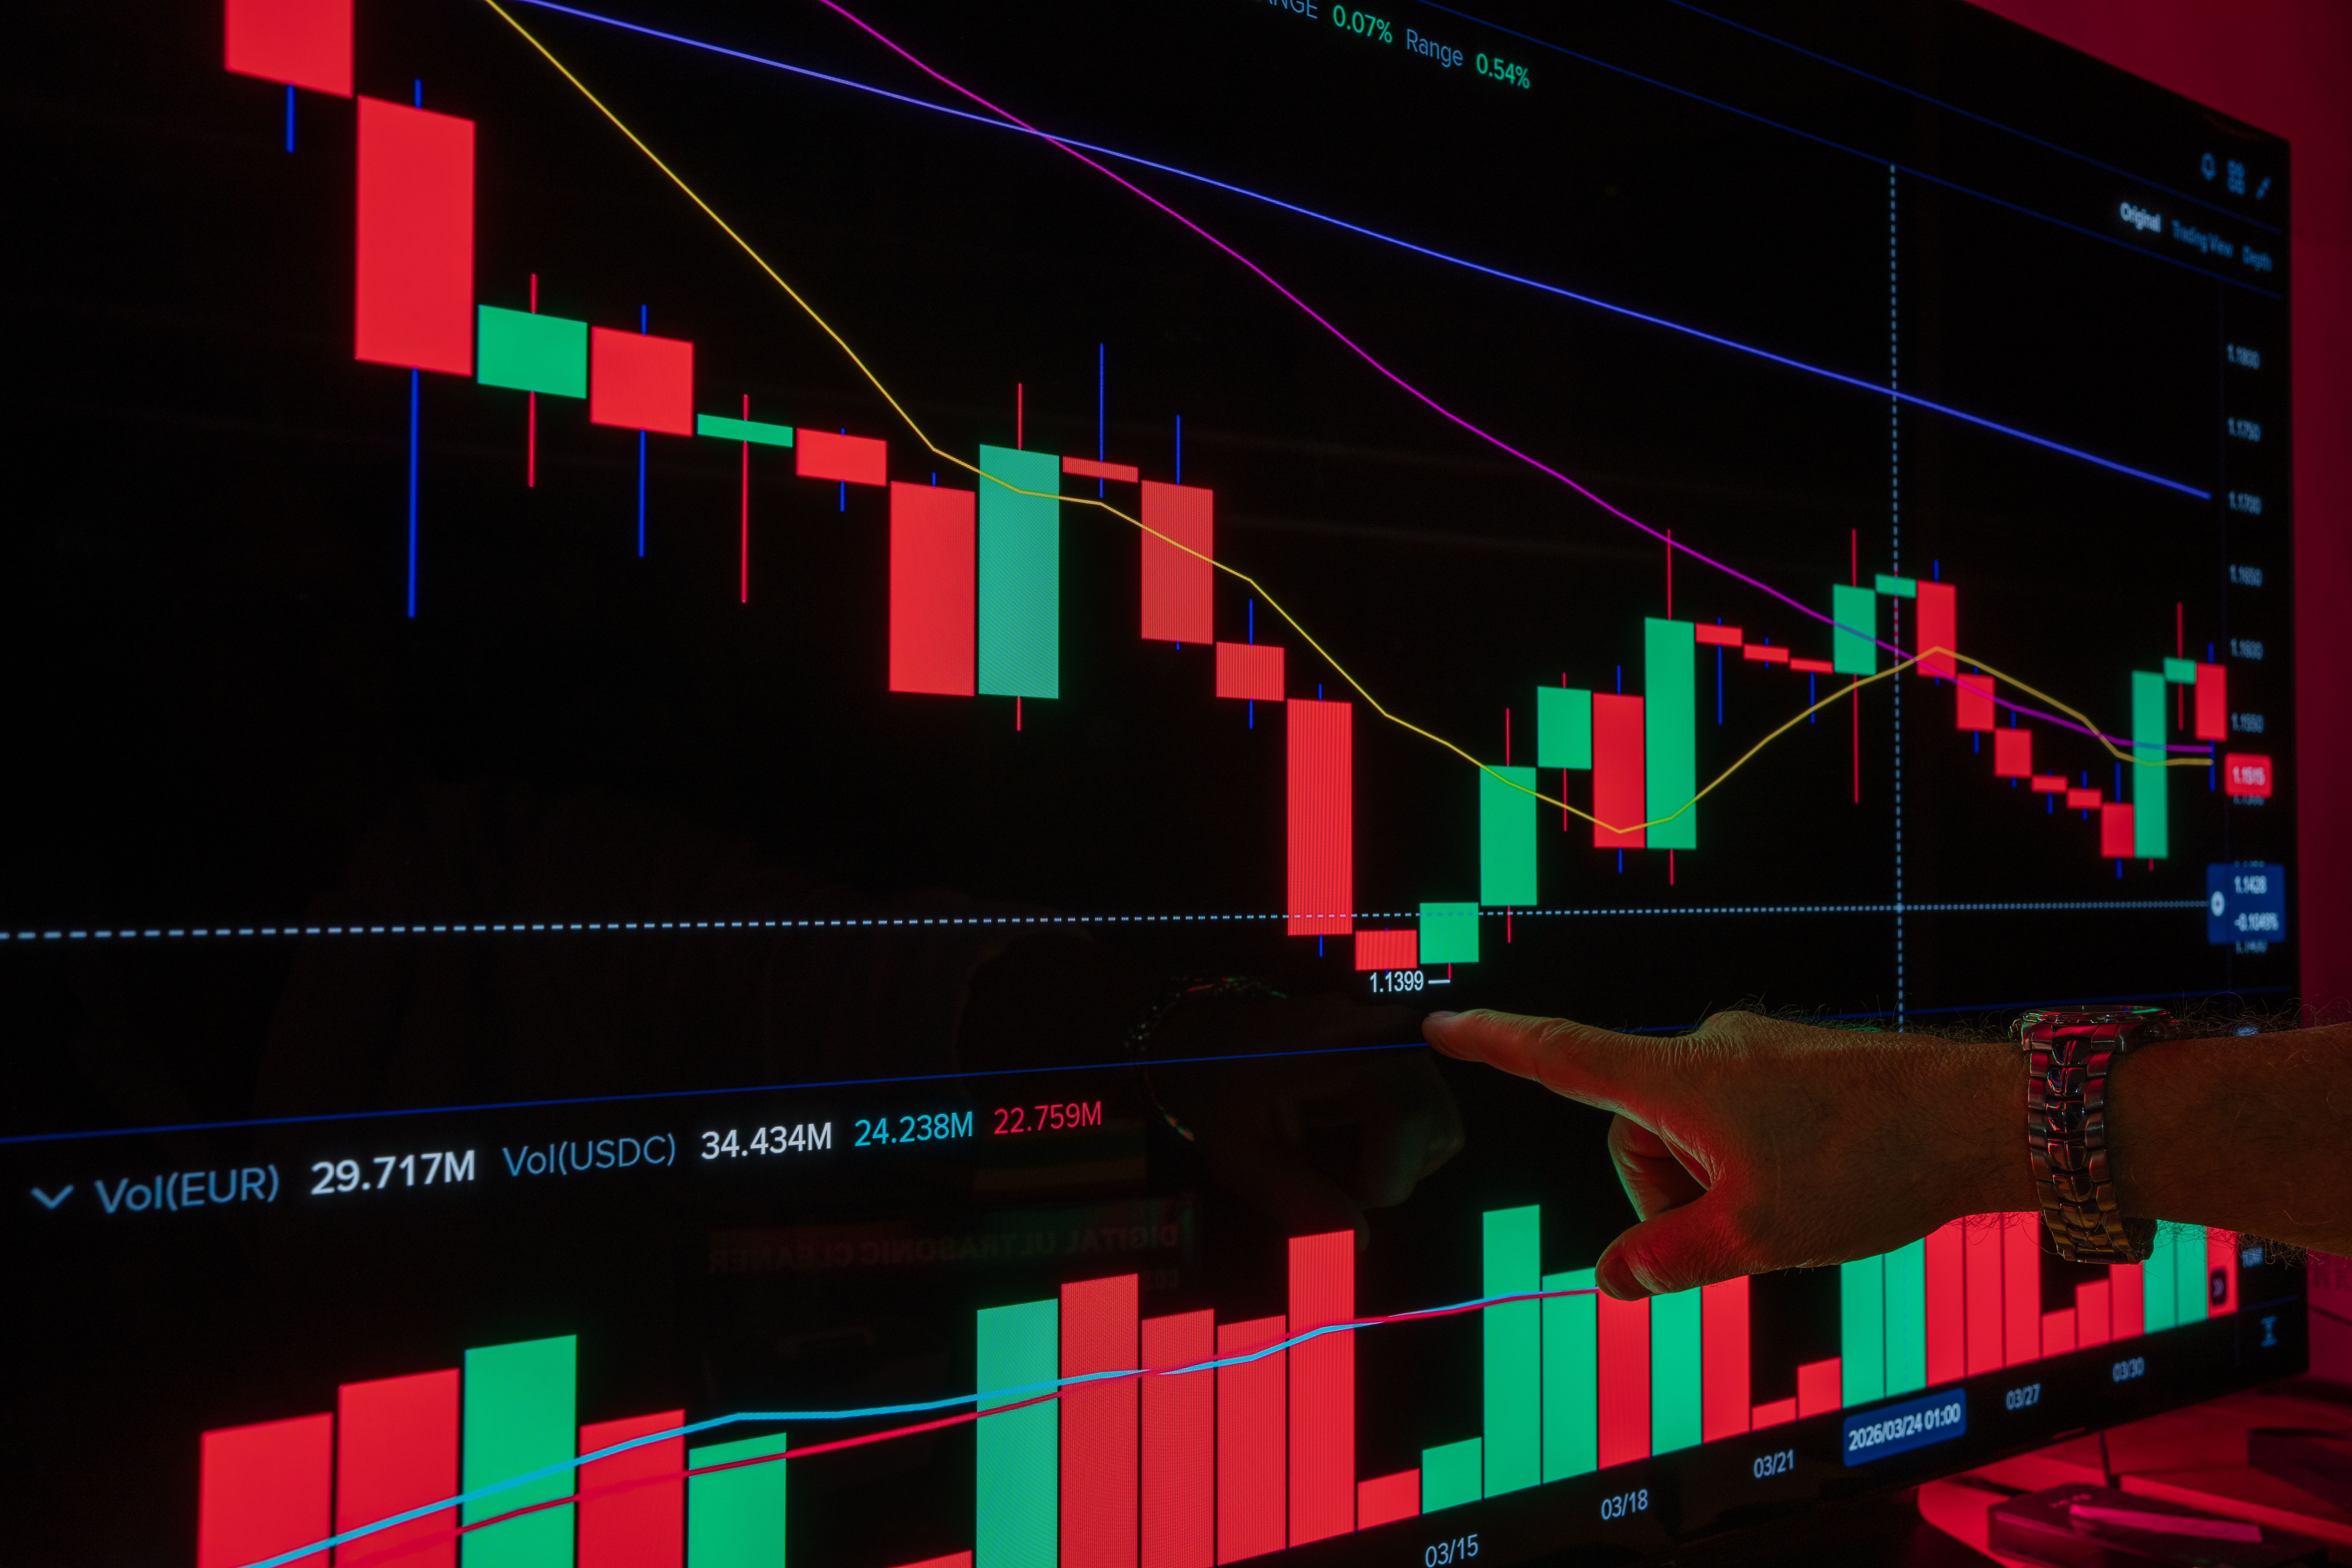
Equities have an official close produced by an exchange auction. Digital assets have nothing equivalent, because the market never stops and no single venue has authority over the price.
Continuous trading removes the natural boundary
An equity market has an opening and closing bell set by an exchange operating in a jurisdiction with fixed hours. Crypto venues run without interruption.
With no session boundary, there is no moment at which the day's trading can be said to have concluded and a final price established.
Any daily figure therefore requires someone to pick an arbitrary cutoff, usually a clock time in a chosen time zone. Different platforms pick different cutoffs, so their daily figures for the same asset need not agree.
Prices are fragmented across venues
The same asset trades simultaneously on many exchanges, each with its own order book, its own participants and its own fee structure.
Those books do not clear at identical prices at every instant, because moving capital and assets between venues takes time and costs money.
So there is no single number to report, only a set of venue prices that arbitrage keeps roughly aligned without forcing them to match exactly.
Reference rates are constructed rather than observed
Index providers and exchanges that list derivatives solve the problem by publishing a reference rate built from multiple venues. The rate is defined by a written methodology rather than taken from any one order book.
The methodology typically blends prices across a window of time and weights venues by volume, so that one thin market cannot dictate the result.
Time averaging also makes the rate expensive to manipulate, since pushing a price for a moment has little effect on an average taken over minutes.
The choice of methodology has real consequences
Contracts that settle against a reference rate pay out based on that specific construction, not on any price a participant may have seen elsewhere.
Two rates covering the same asset can differ if they include different venues or use different windows, which matters for anything valued against them.
Funds holding digital assets face the same question when striking a daily valuation, and their published policy defines what their reported figure means.
Charts hide the convention behind them
A daily candle for a digital asset looks identical in form to one for a stock, which suggests a comparable underlying definition.
The stock candle reflects an auction with regulatory standing. The crypto candle reflects one platform's cutoff time and venue selection.
Comparing the two, or comparing charts from different platforms, requires knowing which convention each is using rather than assuming they describe the same thing.